
The Working Capital Impact of DSO: How to Calculate It for Freight Companies
Why Is DSO a Working Capital Metric, Not Just a Billing Metric?
Days Sales Outstanding is typically discussed in the context of billing and collections: how long it takes to collect payment after an invoice goes out. Operations managers track it. Controllers report it. Ownership glances at it in the monthly financial package.
But DSO isn’t really a billing metric. It’s a working capital metric. Each day of DSO represents a specific dollar amount of the company’s money sitting in someone else’s account. And the working capital impact of even small DSO changes (two days, five days, a week) is larger than most freight companies realize until they run the actual numbers.
This post provides the math, a framework for connecting operational improvements to working capital outcomes, and a self-assessment for freight companies that want to quantify the financial impact of their back-office performance.
How Do You Calculate the Working Capital Impact of DSO?
The working capital impact of DSO is calculated in two steps.
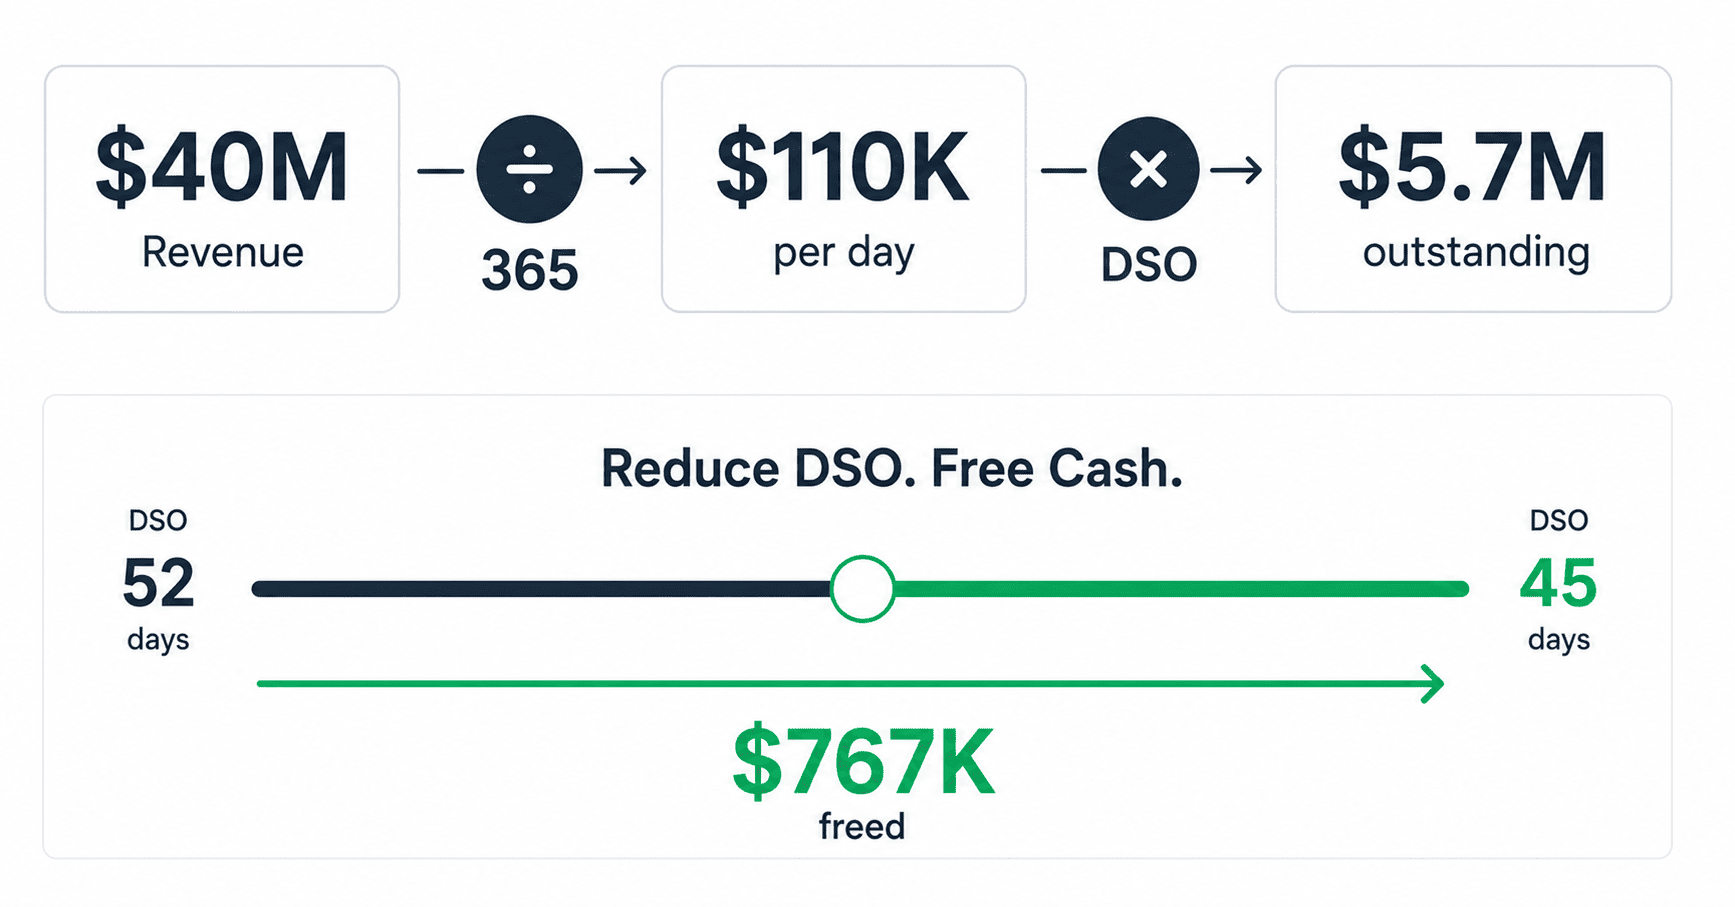
Step one: determine the daily revenue rate. Divide annual revenue by 365.
For a $30M freight company: $30,000,000 ÷ 365 = $82,192 per day.
For a $40M freight company: $40,000,000 ÷ 365 = $109,589 per day.
For a $60M freight company: $60,000,000 ÷ 365 = $164,384 per day.
Step two: multiply the daily revenue rate by the DSO. The result is the total receivables outstanding at any given time.
For a $40M company with DSO of 52 days: $109,589 × 52 = $5,698,630. That’s roughly $5.7 million in receivables outstanding, money that has been earned and invoiced but hasn’t yet been collected.
The working capital impact of a DSO change is the difference between the current receivables level and the receivables level at the new DSO.
If DSO drops from 52 to 47 (a 5-day improvement): $109,589 × 5 = $547,945 in working capital freed up.
If DSO increases from 52 to 57 (a 5-day deterioration): $109,589 × 5 = $547,945 in additional working capital locked up.
Each day of DSO, at $40 million in revenue, is worth approximately $110,000 in working capital. The number scales linearly with revenue: at $60 million, each day of DSO is worth approximately $164,000. At $80 million, approximately $219,000.
These aren’t small numbers. A 5-day DSO improvement at $40 million in revenue frees up nearly $550,000, enough to cover several months of carrier payments, fund a new lane, or reduce factoring dependency significantly.
What Operational Functions Drive Each Day of DSO?
Understanding the working capital math is the first step. The second step is connecting DSO days to specific operational functions, because that connection is what turns the math from an interesting calculation into an actionable improvement plan.
DSO is composed of four operational segments, each of which contributes days to the total (see how to reduce DSO at a freight brokerage).
Billing cycle time: the gap between load delivery and invoice submission. This includes POD retrieval time and invoice preparation time. If the average load delivers on Day 0 and the invoice goes out on Day 3, the billing cycle contributes 3 days to DSO.
Shipper processing time: the gap between invoice submission and the shipper entering the invoice into their payment system. This is partially outside the broker’s control, but submitting a clean, complete invoice (right PO, right documentation, right rate) reduces the shipper’s processing time because it doesn’t trigger manual review.
Payment terms: the agreed-upon payment period, typically net 30. This is contractual and doesn’t change with operational improvements, but it’s the largest single component of DSO.
Collection delay: the gap between when the invoice is due and when payment is actually received. This includes late payments, dispute resolution time, and the effectiveness of the accounts receivable (AR) follow-up cadence.
Of these four components, billing cycle time and collection delay are directly controllable through back-office operations. Shipper processing time is partially influenced by invoice quality. Payment terms are contractual.
How Do Back-Office Improvements Translate to Working Capital Dollars?
Each back-office improvement translates to a specific DSO reduction, which translates to a specific working capital impact. Here’s how the math works for the most common operational levers.
Faster POD retrieval. If average POD turnaround improves from 72 hours to 24 hours, the billing cycle compresses by roughly 2 days (the invoice can go out 2 days sooner). At $40 million in revenue, 2 days of DSO = approximately $219,000 in working capital freed up.
Higher billing accuracy. If the invoice dispute rate drops from 6% to 2% (120 fewer disputed invoices per month at 3,000 loads, each dispute adding 12 days to the payment cycle), the DSO impact is roughly half a day across the portfolio (120 × 12 ÷ 3,000 = 0.48 days). At $40 million, that’s approximately $53,000 freed up.
Structured AR cadence. If the collections cadence shifts from weekly batch processing to daily structured follow-up, the average days past due on overdue invoices typically drops 3 to 5 days. The portfolio-wide DSO impact is 1 to 3 days depending on the percentage of invoices that were being affected by the batch processing gap. At $40 million, 2 days = approximately $219,000. Running that cadence daily without adding headcount is the job of an accounts receivable outsourcing desk. Published composite ranges by company type are in the freight DSO and AR benchmarks.
Pre-billing revenue capture. Capturing missed accessorial charges doesn’t reduce DSO directly (the invoice timing doesn’t change), but it increases the revenue per load, which means the same DSO produces higher cash flow. If a pre-billing audit captures 2% of additional billable revenue on a $40 million book, that’s $800,000 in annual revenue that wasn’t being invoiced before.
Combined, these four levers typically produce a DSO improvement of 3 to 6 days for a freight company that implements all of them, with a working capital impact of roughly $330,000 to $660,000 at $40 million in revenue.
The Compounding Effect
The working capital freed by DSO improvement doesn’t just sit in the bank account (although it could). It becomes available for operational uses that create additional value.
Faster carrier payment. In a tight capacity market, prompt carrier payment is a competitive advantage. Carriers prefer working with brokers who pay quickly and reliably. The working capital freed by DSO improvement can fund faster carrier payment terms, which improves carrier relationships, secures capacity, and may even support preferential rate treatment.
Reduced factoring dependency. Freight companies that factor receivables pay a fee, typically 1.5% to 5% of the invoice amount, for accelerated cash flow. Lower DSO means less need for factoring, which means lower factoring costs. At 3% factoring cost on $1 million in monthly factored receivables, a DSO improvement that eliminates the need for half of that factoring saves $180,000 annually in fees.
Growth funding. A freight company growing from $40 million to $60 million in revenue needs additional working capital to fund the higher receivables balance. Without DSO improvement, the $20 million in revenue growth at 52 days DSO requires an additional $2.85 million in working capital. With DSO improvement to 45 days, the additional working capital needed drops to $2.47 million, a $380,000 difference that no longer has to be financed.
The Self-Assessment
For freight companies that want to quantify their specific working capital opportunity, the DSO calculator on the ClearLane site provides the basic math. Beyond the calculation, this self-assessment helps identify which operational levers have the most impact.
What’s your current billing cycle time? Measure delivery-to-invoice on a sample of 100 loads. If the average is above 48 hours, POD retrieval and/or billing capacity is contributing avoidable DSO days.
What’s your invoice dispute rate? Count the number of disputes received in the last 90 days and divide by the number of invoices submitted. If the rate is above 3%, billing accuracy is a DSO lever worth pulling.
When was the last time you trended your DSO monthly? A single DSO number is a snapshot. The trend over 6 to 12 months tells you whether the situation is stable, improving, or deteriorating, and the rate of change indicates urgency.
What’s the dollar value of one day of DSO at your revenue level? Run the basic calculation: annual revenue ÷ 365. That number (the value of one day) makes every operational improvement discussion more concrete.
Which operational lever is your weakest? If POD turnaround is 72 hours, that’s likely the biggest opportunity. If billing accuracy is 92%, that’s the lever. If AR follow-up is weekly batch processing, that’s the cadence to fix. The weakest lever usually produces the largest improvement because it has the most room to move.
ClearLane’s post-dispatch pipeline addresses all four operational levers simultaneously: POD retrieval, billing accuracy, structured AR collections, and pre-billing revenue capture. The working capital impact is measurable from the first month.
Frequently Asked Questions
Divide annual revenue by 365. At $40 million, each day of DSO equals approximately $110,000 in working capital. At $60 million, approximately $164,000 per day.
Industry benchmarks for freight broker DSO run 45-65 days. The trend matters more than the number: DSO creeping up 2-3 days per quarter signals a back-office capacity problem.
At $40 million revenue, a 5-day improvement frees approximately $550,000 in working capital. At $60 million, approximately $822,000. This money is already earned. It’s just arriving late.
Four levers: faster POD retrieval (compresses the billing cycle by about 2 days), higher billing accuracy (cuts dispute-driven delay by about half a day for every 4-point drop in dispute rate), structured AR cadence (cuts days past due on overdue invoices by 3 to 5 days), and pre-billing revenue capture (increases revenue per load).
Want to see how many days of DSO your operation could claw back? Talk to our team to walk through it. Or email us at info@getclearlane.com.