
Mid-Year Freight Market Check: Volumes, Rates, and What to Watch
What Happened in the Freight Market During the First Half of 2026?
The first half of 2026 confirmed what most industry analysts had been forecasting: the freight market has turned a corner, driven primarily by supply-side contraction rather than a demand-led surge. The prolonged freight recession that defined 2023 through 2025 appears to have bottomed out, and the cycle is shifting.
The key developments through mid-year:
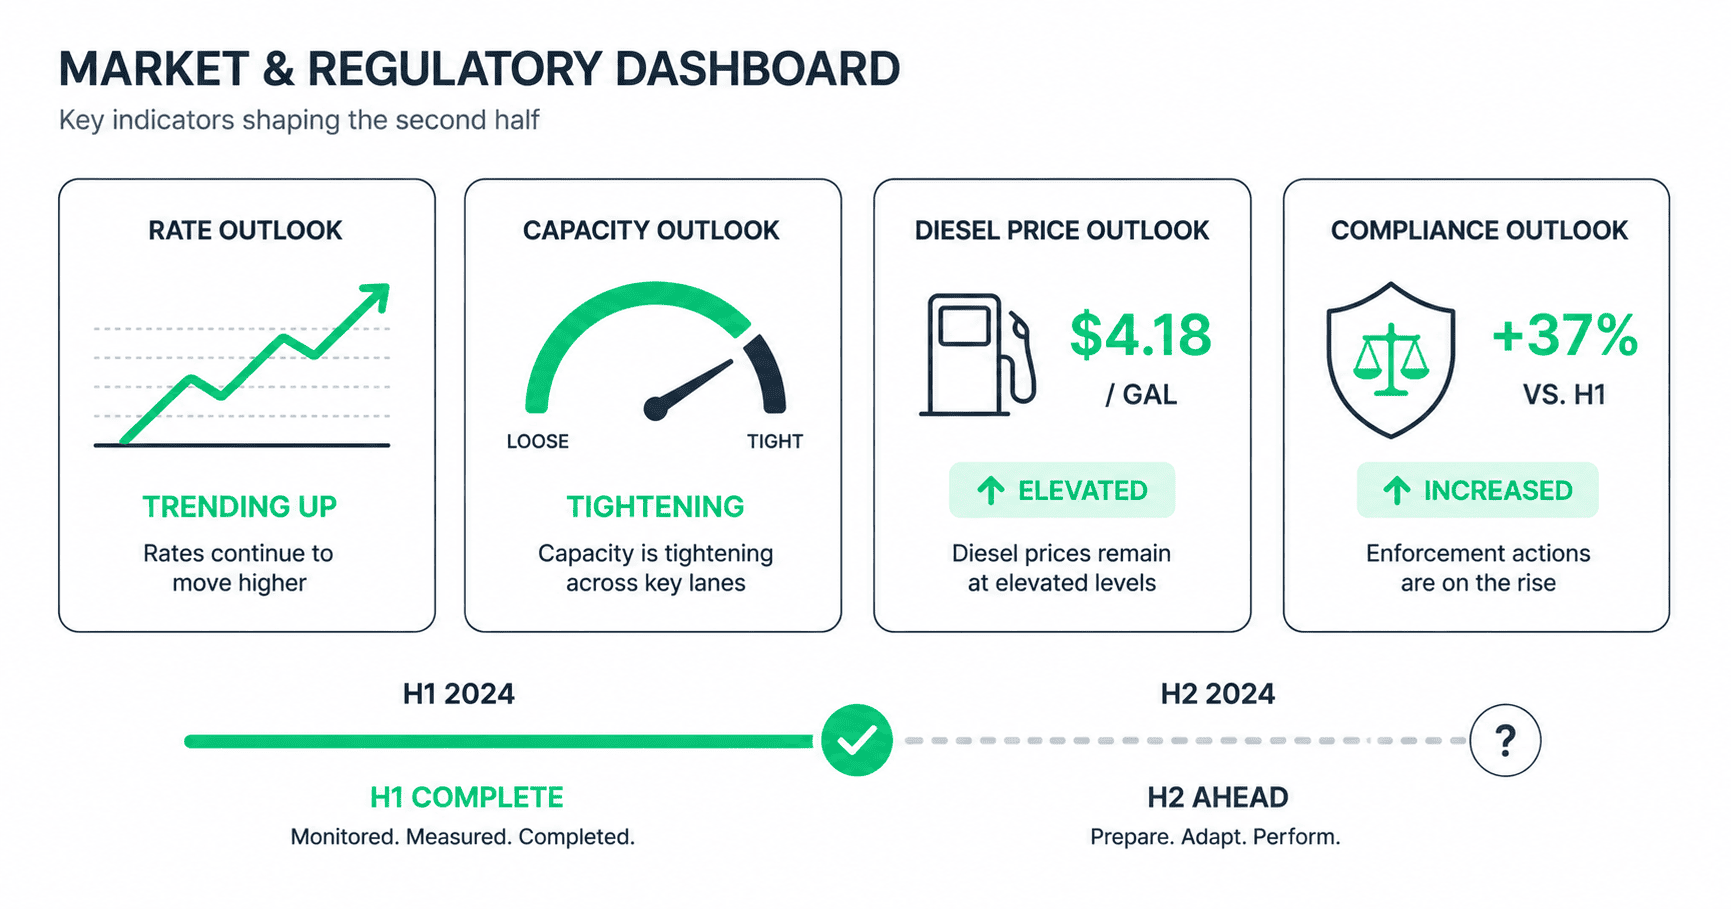
Capacity has tightened meaningfully. Carrier exits from the prolonged soft market continued through the first half of the year. The non-domiciled CDL rule, effective March 16, restricted CDL eligibility to three visa types and is projected to remove approximately 40,000 drivers per year as credentials come up for renewal. Over 13,000 non-domiciled CDLs were canceled in California alone in March. CDL school enforcement intensified, with more than 44% of training providers under federal scrutiny.
Rates moved up across the board. Truckload spot rates are running in the mid-teens percent above year-ago levels. Contract rates followed, with most shippers facing 5-8% increases at renewal. Multiple forecasters now project total truckload costs 10-17% above 2025 for the full year, with the potential to exceed 20% if demand accelerates in the second half.
Diesel surged. Prices climbed from $3.72 to over $5.40 per gallon in March, the highest since mid-2022. While prices have moderated somewhat since that peak, the volatility created fuel surcharge complications across shipper and carrier billing for most of the first half.
Demand recovered gradually. Manufacturing returned to expansion territory. Lean inventories drove restocking. Import volumes climbed. But the demand recovery has been gradual rather than sharp, meaning the rate increases are primarily supply-driven, not demand-driven. This distinction matters because supply-driven rate increases tend to be more durable but less dramatic than demand-driven spikes.
FMCSA enforcement intensified. Beyond the CDL rule, English Language Proficiency became an out-of-service offense (more than 26,000 drivers placed OOS per DOT, as of August 2026). ELD decertifications were enforced starting in February. The MOTUS registration system launched May 14, with real-time validation of registration data; carrier and broker access followed in late May, and MC, FF, and MX numbers were retained at launch. Ongoing compliance monitoring has to keep pace with the data that now surfaces faster. The broker financial responsibility rule took effect in January.
What Should Freight Companies Watch for in the Second Half?
The second half of 2026 will be shaped by several variables that are still in motion.
Demand is the swing factor. Most forecasters project gradual volume improvement in the second half, with more growth expected in Q4. If demand accelerates (through manufacturing expansion, inventory rebuilds, or housing activity), the capacity constraints already in place could push rates significantly higher. If demand stays flat, rates will continue rising but at a more moderate pace driven by ongoing supply contraction.
Carrier attrition may accelerate. The combination of rising insurance costs (five consecutive years of increases), diesel volatility, and regulatory enforcement is pushing marginal carriers out of the market faster. Each carrier exit tightens capacity further. The smaller the carrier, the faster they exit, and small carriers (10 trucks or fewer) represent over 90% of the trucking industry.
Tariff and trade policy creates freight volume uncertainty. Trade policy changes, tariff negotiations, and import volume shifts can rapidly alter freight demand in specific lanes and regions. The first half saw volatility in import volumes driven by tariff-related front-loading and sourcing strategy changes. The second half could see similar volatility depending on policy developments.
Intermodal is gaining traction as a cost alternative. With truckload rates climbing, shippers are shifting volume to intermodal on long-haul lanes where the transit time penalty is acceptable. Intermodal volumes are projected to grow roughly 10% year-over-year, and the cost advantage over truckload is expected to widen as truck rates continue rising. For freight brokerages, this means monitoring which lanes are at risk of modal shift, and ensuring the billing and accounts payable (AP) processes can handle intermodal documentation alongside truckload.
Produce season and peak season will test capacity. The spring-summer produce season and the fall retail peak season both create capacity pressure that amplifies the underlying tightness. In a market that’s already tighter than it was a year ago, seasonal pressure will likely produce more pronounced spot rate spikes than in recent years.
How Are Market Conditions Affecting Freight Back-Office Operations?
We covered the back-office impact of market tightening earlier this year. Mid-year data confirms the trends we identified.
Market consolidation, as weaker carriers exit and companies change hands, has a second-order effect on the back office. Companies buying or selling need records a buyer can verify, and companies operating under credit facilities need reporting delivered on the lender calendar rather than their own. Both are documentation problems before they are financial ones. See owner, lender, and transaction reporting.
Rate volatility is increasing billing exceptions. Billing teams at freight brokerages report higher exception rates, more rate discrepancies between rate confirmations and TMS data, more fuel surcharge calculation mismatches, and more mid-cycle contract adjustments that create billing inconsistencies. The exception rate multiplier that volatile markets create is showing up in dispute volumes and DSO trends.
Accessorial disputes have increased. As the market tightened, carriers began billing at full contractual terms for detention, layover, and other charges they had been absorbing during the soft market. This created a wave of new charges flowing through AP, each requiring verification, and a corresponding wave of charges that should flow through to shipper invoices but don’t always make it. The pre-billing audit function has become more valuable as the accessorial volume has increased.
Compliance monitoring workload has grown sharply for many of the brokers we work with. The pace of authority changes, insurance events, and CDL-related compliance shifts has accelerated. Brokerages that were monitoring carrier compliance quarterly are finding that quarterly isn’t fast enough: carrier status can change multiple times between reviews, and compliance gaps open in between.
Staff capacity is being tested. Back-office teams that were running at 85-90% capacity during the soft market are now at 100% or above, handling the same load volume with higher complexity per load. Overtime hours are up. Triage is more aggressive. Lower-priority functions (compliance monitoring, pre-billing audits, detailed carrier invoice verification) are being deferred in favor of the immediate work of getting invoices out and payments in.
Questions for the Second Half
For freight companies planning for the rest of the year, these operational questions are worth addressing now rather than waiting for Q4:
Does your back-office capacity match the complexity the market is creating? If your team was appropriately staffed for a stable market with low exception rates, they may be understaffed for a volatile market with high exception rates. The gap will widen in the second half as seasonal pressure compounds market-driven complexity.
Are you capturing accessorial charges at the same rate as six months ago? As carriers bill more accessorials, the capture rate on the shipper billing side should increase proportionally. If it hasn’t (if more accessorial charges are hitting AP but not flowing through to shipper invoices), you’re absorbing margin pressure that should be billed through.
Is your compliance monitoring keeping pace with the enforcement environment? The second half will bring additional FMCSA actions (broker transparency rule, Drug and Alcohol Clearinghouse changes, potential automated driving system regulations). Carrier compliance status is changing faster than in prior years. Your monitoring frequency should match.
What’s your DSO trend over the last two quarters? If it’s moving up, even slightly, the market-driven billing complexity is likely a contributing factor. Identifying whether the increase is driven by POD delays, billing errors, accessorial disputes, or accounts receivable (AR) aging tells you where to direct additional capacity.
The freight market recovery is good news for revenue. The back-office capacity to support that revenue (billing accurately, paying carriers correctly, monitoring compliance effectively, and collecting receivables on time) determines whether the revenue growth translates into cash flow improvement or just more work for the same team.
Frequently Asked Questions
Truckload costs are projected 10-17% above 2025 levels, with spot rates running in the mid-teens percent above year-ago levels. Contract rates are following with 5-8% increases at renewal.
Non-domiciled CDL restrictions could remove approximately 40,000 drivers per year. More than 26,000 drivers have been placed out of service for English Language Proficiency violations, per DOT figures as of August 2026. ELD decertifications are being enforced at roadside inspections.
Rate volatility increases billing exceptions, accessorial disputes spike as carriers reassert contract terms, compliance monitoring workload grows sharply, and back-office staff capacity is tested by higher complexity per load alongside growing volume.
Assess whether back-office capacity matches the complexity the market is creating. Monitor DSO trends, accessorial capture rates, and compliance monitoring frequency, and scale capacity proactively rather than waiting for cash flow to force the conversation.
Want to pressure-test your back office as the market tightens? Talk to our team to walk through it. Or email us at info@getclearlane.com.
Background: the freight operations optimization guide. See the full service list for where each function sits.